Refer to the graph shown. In 1975 U.S. President Gerald Ford instituted a large tax cut. At the same time, the Fed expanded the money supply. The effect of these policies on the AD curve is best shown as a movement from: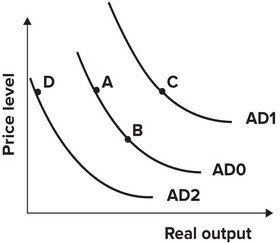
A. A to D.
B. A to B.
C. B to A.
D. D to A.
Answer: D
You might also like to view...
Refer to the table above. At what rate did the country grow between 2006 and 2007?
A) 13.63% B) 17.47% C) 15.55% D) 19.24%
One reason earnings tend to fall before retirement age is that
A) the experience of people is no longer valuable after they are 50 or 55. B) people tend to reduce the number of hours they work after age 50. C) people are retiring earlier. D) firms discriminate against older workers.
Loans are: a. assets of banks, liabilities of borrowers. b. liabilities of banks, assets of borrowers. c. assets of banks and their borrowers
d. liabilities of banks and their borrowers.
When we add up the total payments made to households that furnish the resources used to produce the goods and services in the economy, we are using
a. the income approach b. the expenditure approach c. the output approach d. the aggregate demand approach e. GDP product