Refer to Figure 7-1. Marginal social benefit is represented by which curve?
A) Supply
B) D1
C) D2
D) All of the above represent marginal social benefit.
C
You might also like to view...
Based on the figure below. Starting from long-run equilibrium at point C, a decrease in government spending that decreases aggregate demand from AD1 to AD will lead to a short-run equilibrium at__ creating _____gap.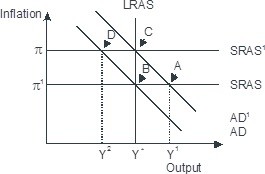
A. B; no output B. D; an expansionary C. B; recessionary D. D; a recessionary
In a graph with output in the Y axis and efficiency units of labor in the X axis, which of the following causes a rightward movement along the aggregate production function?
A) A decrease in the capital stock B) An increase in the total efficiency units of labor C) An improvement in technology D) A decrease in the productivity of workers
Which of the following clearly restricts the competitive market process?
A) Selling below cost B) Selling above cost C) Selling at cost D) Setting a price above marginal cost E) None of the above.
If a firm is producing an output level for which the market price exceeds the firm’s marginal cost,
a. consumers would be willing only to pay a price lower than what it costs the firm to produce another unit. b. consumers would be willing only to pay a price equal to what it costs the firm to produce another unit. c. consumers would be willing to pay a price greater than what it costs the firm to produce another unit. d. consumers would be willing only to pay a price equal to or lower than what it costs the firm to produce another unit.