Refer to the information provided in Figure 2.4 below to answer the question(s) that follow.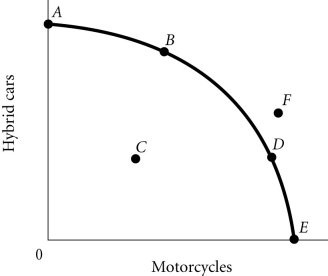 Figure 2.4According to Figure 2.4, Point E necessarily represents
A. only motorcycles being produced.
B. overallocation of resources.
C. an impossible production point.
D. technological advancement.
Answer: A
You might also like to view...
Answer the next question using the following budget information for a hypothetical economy. Assume that all budget surpluses are used to pay down the public debt. Government SpendingTax RevenuesGDPYear 1$450$425$2,000Year 25004503,000Year 36005004,000Year 46406205,000Year 56805804,800Year 66006205,000If year 1 is the first year of this nation's existence and year 4 is the present year, the public debt as a percentage of GDP in year 4 is
A. 3.9%. B. 2.5%. C. 1.39%. D. 7.5%.
Aggregate demand and supply curves have been widely used to analyze the performance of the macroeconomy. Figure 5-3 shows four diagrams that represent different changes in the macroeconomy. Choose the diagram that best represents the situations described in the following questions.Figure 5-3
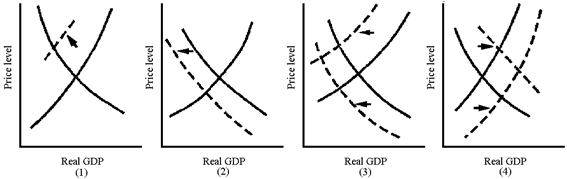 Which graph in Figure 5-3 best represents the economic conditions of the American economy in 2001?
A. 1 B. 2 C. 3 D. 4
Refer to the scenario above. If the first household pays 20% of its income as tax,
the second household pays 17.5% of its income as tax, the third household pays 13% of its income as tax, and the fourth household pays 10% of its income as tax, income taxes are ________ in nature. A) progressive B) regressive C) cardinal D) ordinal
We can expect producers to pay:
A. None of these statements is true. B. less for land with lower productivity. C. more for land with lower productivity. D. less for land with higher productivity.