Refer to Figure 3-8. The graph in this figure illustrates an initial competitive equilibrium in the market for apples at the intersection of D1 and S1 (point A). If there is a shortage of apples, how will the equilibrium point change?
A) There will be no change in the equilibrium point.
B) The equilibrium point will move from A to B.
C) The equilibrium point will move from A to C.
D) The equilibrium point will move from A to E.
A
You might also like to view...
The basic problem addressed in economics is
a. scarce resources and unlimited wants b. scarce wants and unlimited resources c. cost minimization d. how to manage a financial portfolio e. unlimited time and unlimited potential
Amy can produce either 5,000 pounds of cheese or 20 cars per year. Mike can produce either 5,000 pounds of cheese or 10 cars per year. By the principle of comparative advantage, Mike should specialize in producing
A. cars. B. cheese. C. both cheese and cars. D. neither cheese nor cars.
An action taken by one company to buy a controlling interest in the coming stock of another company
What will be an ideal response?
Refer to the graph shown. Assume the market is initially in equilibrium at point b in the graph but the imposition of a per-unit tax on this product shifts the supply curve up from S0 to S1. The amount of revenue government will collect from this tax is equal to the: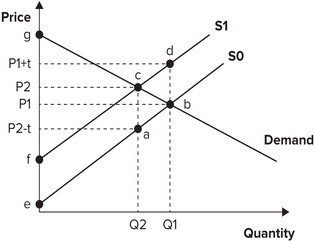
A. area of the triangle bcd. B. area of the triangle abc. C. amount of the per-unit tax multiplied by Q1. D. amount of the per-unit tax multiplied by Q2.