Explain what scatter diagrams show and why we use them
What will be an ideal response?
Scatter diagrams plot the value of one economic variable against the value of another variable for a number of different values of each variable. We use scatter diagrams because they quickly reveal if a relationship exists between the two variables. Moreover, if a relationship exists, scatter diagrams show whether increases in one variable are associated with increases or decreases in the other variable.
You might also like to view...
A price floor establishes a minimum price, and a price ceiling establishes a maximum price
Indicate whether the statement is true or false
Why are the prices of some regulated industries often higher than they would be if there were no regulation?
Which of the following examples is shown in this graph?
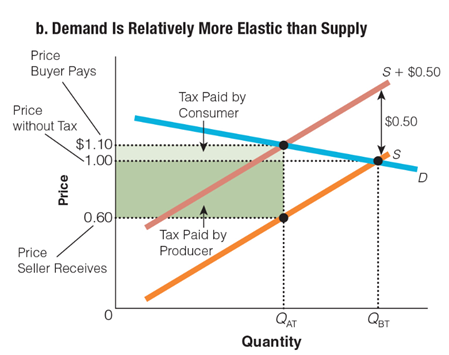
a. The buyer pays $0.50 of a $0.50 tax.
b. The buyer pays $0.40 of a $0.50 tax.
c. The seller pays $0.50 of a $0.50 tax.
d. The seller pays $0.40 of a $0.50 tax.
A situation in which output decreases while prices increase is often referred to as:
A. inflation. B. negative economic growth. C. a recession. D. stagflation.