The graph of a function is given. Determine whether the function is increasing, decreasing, or constant on the given interval.(1, 2)
A. constant
B. increasing
C. decreasing
Answer: B
You might also like to view...
Find percent notation for the fraction notation in the sentence.In one town,  of those with a college education end up moving away to a larger city.
A. 300% B. 0.3% C. 30% D. 3%
Subtract and check the difference.
A. 107 B. 87 C. 109 D. 85
Solve the problem.The table shows the percentage of people living below the poverty line in one U.S. city in the years 2000 through 2003. 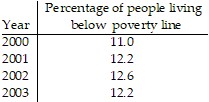 The data in the table can be written as ordered pairs (x, y) where x is the number of years after 2000 and y is the percentage of people living below the poverty line in that year. Use the data for 2000, 2002, and 2003 to find the quadratic function
  that models the percentage, y, of people in this city living below the poverty line x years after 2000. [Hint: Find a, b, and c by substituting each of three ordered pairs into the
function and writing and solving a system of linear equations in three variables.] A. y = -0.4x2 + 1.6x + 11.0 B. y = -0.5x2 + 1.8x + 11.0 C. y = -0.3x2 + 1.4x + 11.0 D. y = -0.3x2 + 1.3x + 11.0
Simplify the complex fraction.
A. 
B. 
C. 
D. 