Refer to the graph shown. If this graph represents a monopoly market, the equilibrium price and quantity will be: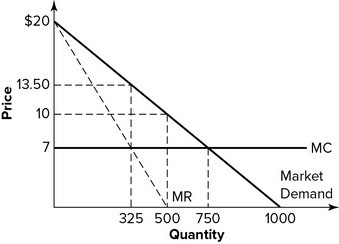
A. Qd= 50 - 1,000P.
B. Qd= 1,000 - 20P.
C. Qd= 20 - 1,000P.
D. Qd= 1,000 - 50P.
Answer: D
You might also like to view...
As a result of heavy spring rains in the Midwest, the corn crop declined sharply. If corn growers experienced an increase in sales revenue, the demand for corn must be
a. price elastic b. price inelastic c. unitary elastic d. perfectly inelastic e. perfectly elastic
Economics is the study of how:
a. humans make decisions in the face of scarcity. b. resources are used to meet human needs. c. humans make decisions when there is an abundance of goods. d. human needs translate to business transactions.
Figure 7-8
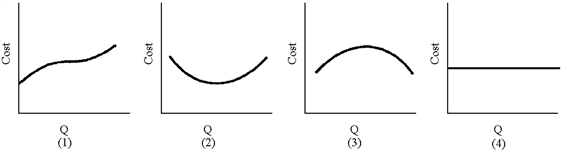
Of the graphs in Figure 7-8, which represents fixed cost?
a.
1
b.
2
c.
3
d.
4
If a labor union strike significantly reduced the supply of coffee for all the coffee producers in a country, which of the following would most likely happen, as shown in this graph?
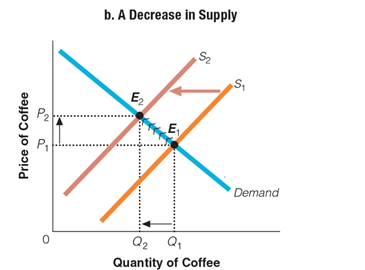
a. Q2 would move to Q1
b. Q1 would move to Q2
c. P2 would move to P1
d. P2 would remain constant