Graph using a graphing calculator.(x + 3)2 + (y - 3)2 = 4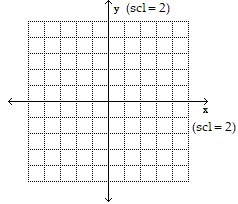
A. 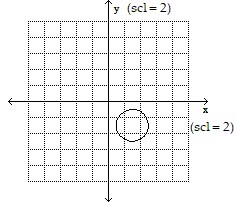
B. 
C. 
D. 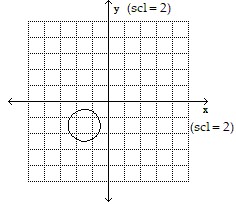
Answer: C
You might also like to view...
Graph the functions on the same grid.y = 2ex and y = log e x - log e 2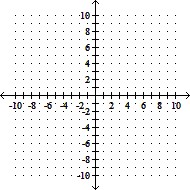
A. 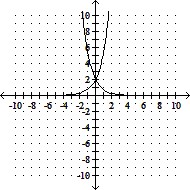
B. 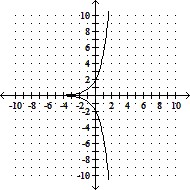
C. 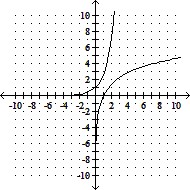
D. 
Write as an exponential equation.log28 = 3
A. 28 = 3 B. 83 = 2 C. 32 = 8 D. 23 = 8
Evaluate the function for the indicated input and interpret the result.The table lists the number of persons voting in an election by election year and sex, for a small community. 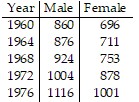 Let this table be a partial numerical representation of a function f, where
  computes the number of persons who voted in the year x whose sex is y. Evaluate
  Interpret the result.
A. f (1972, Male) = 1011 The number of males who voted in 1972 was 1011. B. f (1972, Male) = 876 The number of males who voted in 1972 was 977. C. f (1972, Male) = 1004 The number of males who voted in 1972 was 1004. D. f (1972, Male) = 1011 The number of people who voted in 1972 was 1011, all male.
The graph shows the region of feasible solutions. Find the maximum or minimum value, as specified, of the objective function.objective function = 3x + y; maximum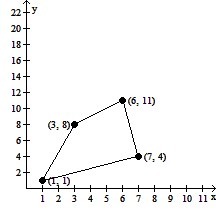
A. 25 B. 7 C. 29 D. 39