Solve the problem.The following table shows the number of housing starts in a beachside community in various years. Let f(t) be the number of housing starts at t years since 2009. Use a graphing calculator to draw a scatterplot. Find and verify an equation of f.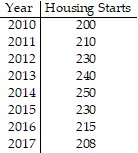
A. f(t) = 3.268t2 + 30.494t + 168.982
B. f(t) = -3.268t2 - 30.494t + 168.982
C. f(t) = -3.268t2 + 30.494t + 168.982
D. f(t) = -3.268t2 + 30.494t - 168.982
Answer: C
You might also like to view...
The circle graph below shows the number of pizzas consumed by college students in a typical month. Use the graph to answer the question.  What percent of college students consume more than 7 pizzas in a typical month?
A. 2% B. 5% C. 34% D. 18%
Refer to a triangle ABC.If A = 27°23' and C = 69°18', find B.
A. 263°59' B. 264°59' C. 83°19' D. 84°19'
Three players (one divider and two choosers) are going to divide a cake fairly using the lone divider method. The divider cuts the cake into three slices (s1, s2, and s3).If the choosers' declarations are Chooser 1: {s2 , s3} and Chooser 2: {s1 , s3}, which of the following is not a fair division of the cake?
A. Chooser 1 gets s1; Chooser 2 gets s3; Divider gets s2. B. Chooser 1 gets s2; Chooser 2 gets s3; Divider gets s1. C. Chooser 1 gets s2; Chooser 2 gets s1;Divider gets s3. D. Chooser 1 gets s3; Chooser 2 gets s1; Divider gets s2. E. none of these
Change the decimal into a proper fraction or mixed number. Simplify if necessary. 0.984
A. 
B. 
C. 
D. 