In the figure above, U.S. producers' ________ from the tariff is ________
A) loss; $32 million
B) loss; $64 million
C) gain; $80 million
D) gain; $128 million
C
You might also like to view...
The aggregate demand curve shows the ________.
A. inverse relationship between the price level and the quantity of real GDP purchased B. direct relationship between real-balances and the quantity of real GDP purchased C. direct relationship between the price level and the quantity of real GDP produced D. inverse relationship between interest rates and the quantity of real GDP produced
Revenues when a firm engages in peak-load pricing based on the figure below will be: 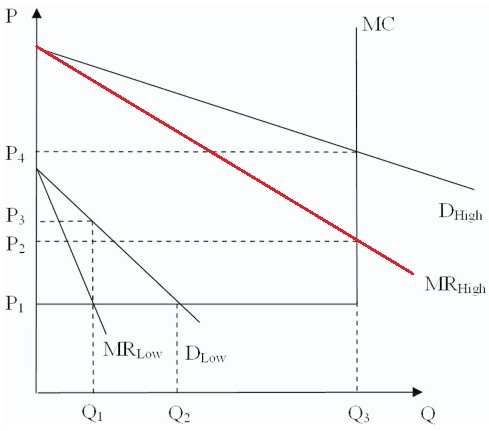
A. (P4 × Q3). B. (P1 × Q2) + (P2 × Q3). C. (P3 × Q1) + (P4 × Q3). D. (P1 × Q1) + (P4 × Q3).
The role of the entrepreneur in society is to:
a. Bring the factors of production together and take the risks of producing b. Control the land upon which all production takes place to get the most rent c. Provide capital to the firm which the management combines with labor d. Work with other elected officials to determine what goods are produced
If your income increases from $40,000 to $48,000 and your consumption increases from $35,000 to $39,000, your marginal propensity to consume (MPC) is:
A. 0.20. B. 0.40. C. 0.50. D. 0.80.