Based on the figure below. Starting from long-run equilibrium at point C, an increase in government spending that increases aggregate demand from AD to AD1 will lead to a short-run equilibrium at point ________ creating _____gap. 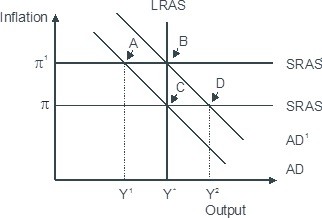
A. D; an expansionary
B. B; no output
C. B; expansionary
D. A; a recessionary
Answer: A
You might also like to view...
When a baker exchanges a pie for dollars, this is an example of dollars serving as
A. a unit of account. B. a store of value. C. a medium of exchange. D. barter.
Whenever a buyer and a seller agree to trade
A) they must have identical opportunity costs in producing their respective products. B) the agreement is made based on absolute advantage. C) one party will always be worse off. D) both must believe they will be made better off.
If the CPI was 102.4 in Year 1 and was 105.7 for Year 2, then the rate of inflation between Year 1 and Year 2 was:
(a) 2.2%. (b) 3.2%. (c) 4.2%. (d) We need more information to calculate it.
Refer to the short-run production and cost data. In Figure A curve (1) is:
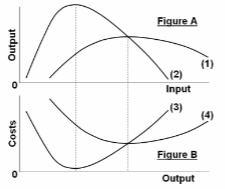
A. total product and curve (2) is average product.
B. total product and curve (2) is marginal product.
C. average product and curve (2) is marginal product.
D. marginal product and curve (2) is average product.