Solve the problem.For some reason the quality of production decreases as the year progresses at a light bulb manufacturing plant. The following data represent the percentage of defective light bulbs produced at a light bulb manufacturing plant in the corresponding month of the year. 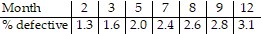 Use linear regression to predict in which month the percentage of defective light bulbs would be 1.83%.
A. April
B. February
C. March
D. May
Answer: A
Mathematics
You might also like to view...
Construct a frequency polygon. 

A. Frequency
| Number of vacation days |
B. Frequency
| Number of vacation days |
Mathematics
Describe the distributions with a pie chart.The following figures give the economic distribution for 5,000 people who live in a certain county.PoorMiddle IncomeRich1,500?3,000?500
A. 
B. 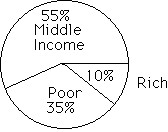
Mathematics
Sketch the surface z = f(x,y).f(x, y) = x2
A. 
B. 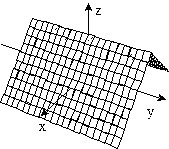
C. 
D. 
Mathematics
Convert the length as indicated. Round the answer to one decimal place.2.4 feet to centimeters (feet ? inches ? centimeters)
A. 73.2 cm B. 6.1 cm C. 61.0 cm D. 94.5 cm
Mathematics