Graph the equation by plotting points.y = 2x + 8
A. 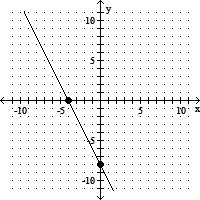
B. 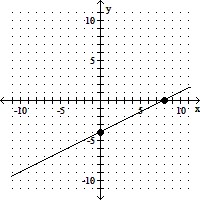
C. 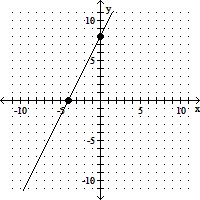
D. 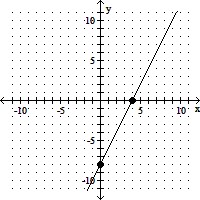
Answer: C
You might also like to view...
Evaluate the expression for the given values of the variables. for x =
  , y =
, y =  , z =
, z = 
A. 
B. 
C. 
D. 
Solve the problem.The following graph shows the private, public and total national school enrollment for students for select years from 1970 through 2000.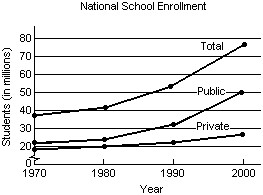 i) How is the graph for total school enrollment, T, determined from the graph of the private enrollment, r, and the public enrollment, u?ii) During which 10-year period did the total number of students enrolled increase the least?iii) During which 10-year period did the total number of students enrolled increase the most?
A.
| i) | T is the sum of r and u. |
iii) 1970-1980
B.
| i) | T is the sum of r and u. |
iii) 1980-1990
C.
| i) | T is the difference of r and u. |
iii) 1990-2000
D.
| i) | T is the sum of r and u. |
iii) 1990-2000
Use properties of logarithms to expand the logarithmic expression as much as possible. Where possible, evaluate logarithmic expressions without using a calculator.logb(yz2)
A. 2 logb y + 2 logb z B. 2 logb(yz) C. logb y + 2 logb z D. logb y + logb(2z)
Solve by completing the square.3x2 - 18x + 42 = 0
A. -3 - i
B. 3 + i , 3 - i
C. 3 + i , -3 - i
D. 3+ i