The circular flow diagram depicts the economy consisting of:
a. the government and households.
b. households and international companies.
c. households and firms.
d. firms and the government.
c. households and firms.
You might also like to view...
In the market shown in Exhibit 3-15, the equilibrium price and quantity of good X are:
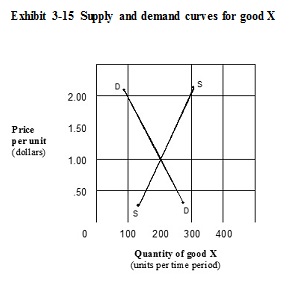
A. $0.50, 250.
B. $2.00, 300.
C. $2.00, 100.
D. $1.00, 200.
A decrease in the interest rate, other things being equal, causes a(n):
A. upward movement along the demand curve for money. B. downward movement along the demand curve for money. C. rightward shift of the demand curve for money. D. leftward shift of the demand curve for money.
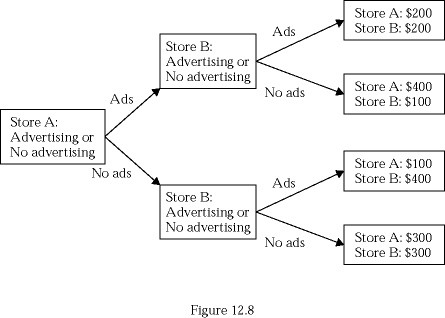 Figure 12.8 depicts an advertising game between two stores. "Advertising" is:
A. a dominant strategy for Store A but not for Store B. B. a dominant strategy for Store B but not for Store A. C. a dominant strategy for both stores. D. a dominant strategy for neither store.
The trough of a business cycle occurs when ________ hits its lowest point.
A. the money supply B. aggregate economic activity C. the unemployment rate D. inflation