What can lead to the shift illustrated in the figure above?
What will be an ideal response?
A decrease in the money wage rate or in the money prices of other resources, such as the price of oil, increase aggregate supply and shift the AS curve rightward while not changing potential GDP.
You might also like to view...
Refer to Figure 7.6. Graph A represents:
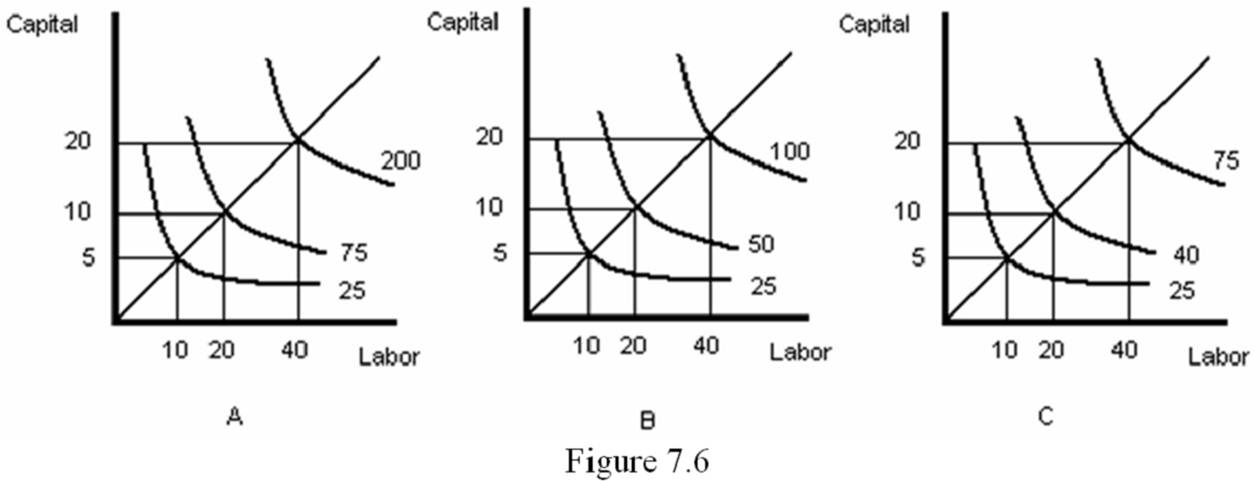
A. increasing returns to scale.
B. decreasing returns to scale.
C. constant returns to scale.
D. diminishing marginal returns.
The principle of “comparable worth” asserts that people with comparable, if not identical, skills and responsibilities should receive the same pay. If this principle were to become law, it would tend to
A. reduce the problem of the “cost disease of services.” B. exacerbate the problem of the “cost disease” of the service sector. C. be irrelevant to the “cost disease” problem. D. eliminate the problem of externalities.
A liability for a commercial bank is its demand deposits
a. true b. false
A proposal to build a dam on a wild river may look like a good idea from the cost/benefit study done by the Army Corps of Engineers, but an analysis done by the Sierra Club might suggest that the dam would be a complete waste of money. When different groups give us radically different cost/benefit results:
A. we should conclude that the best way to decide who is telling the truth is to find which group has the best intentions. B. the studies may still be useful if we can see the underlying assumptions and estimates of each group. C. we have an example of how cost/benefit analysis does not work as a way of forming policy. D. we should realize that sometimes it is best to trust in the political process rather than try to use an economic approach.