Graphs are useful because of the way they
A. facilitate interpretation and analysis of data.
B. clarify interpretation and analysis of ideas.
C. permit a person to easily see relationships.
D. convey an idea that might otherwise take many words.
E. All of these responses are correct.
Answer: E
You might also like to view...
Refer to the figure below. Suppose the solid line shows the current demand curve for coffee. In response to an announcement that much of next year's coffee crop has been destroyed by a storm in Brazil, you should expect: 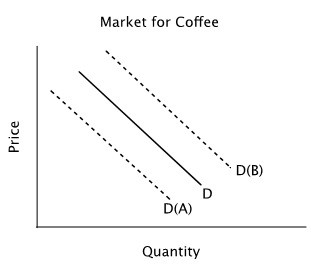
A. the demand curve to shift to D(A) in anticipation of higher future prices. B. the demand curve to shift to D(B) in anticipation of higher future prices. C. an increase in the quantity of coffee demanded, but no shift in the demand curve. D. neither a change in quantity demanded nor a shift in demand because next year's coffee crop will not affect the current demand for coffee.
In the above figure, start with the economy in equilibrium at point A. Then an unanticipated reduction in aggregate demand triggers a shift from AD1 to AD2. In the short run, this would cause
A) the price level to move from P1 to P2, but real Gross Domestic Product (GDP) would stay at Y1. B) the price level to fall from P1 to P2, real Gross Domestic Product (GDP) to fall from Y1 to Y2, and the rate of unemployment to increase. C) the price level to fall by some amount less than P1 but greater than P2, and the rate of unemployment would decrease. D) no change in either the price level or real Gross Domestic Product (GDP), but a decrease in unemployment.
Which of the following most accurately describes the behavior of the U.S. economy during the 2001 recession?
A) Aggregate demand fell as business investment declined while aggregate supply rose as a result of continued productivity growth. B) Aggregate demand fell primarily as a result of reduced consumption while aggregate supply increased due to continued growth in productivity. C) Aggregate demand fell due to a reduction in business investment while aggregate supply declined due to a reduction in productivity. D) Aggregate demand fell due to the bursting of the housing bubble while aggregate supply fell due to slower productivity growth.
In a given year, a country's GDP = $9841, net factor payments from abroad = $889, taxes = $869, transfers received from the government = $296, interest payments on the government's debt = $103, consumption = $8148, and government purchases = $185. The country had private saving equal to
A. $2112. B. $2397. C. $285. D. $3850.