Exhibit 3-3 Demand curves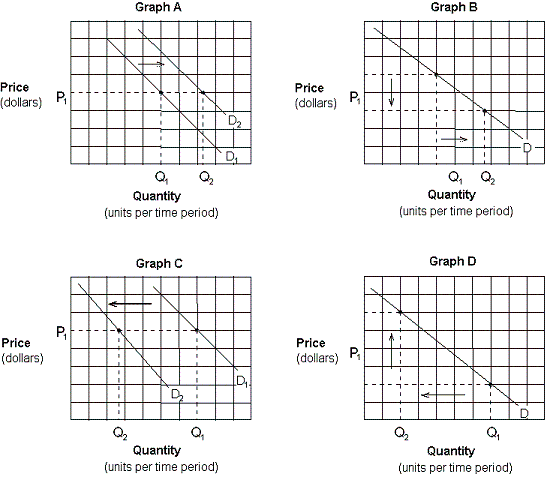
Which of the graphs in Exhibit 3-3 depicts the effect of an increase in income on the demand for pork and beans (an inferior good)?
A. Graph A.
B. Graph B.
C. Graph C.
D. Graph D.
Answer: C
You might also like to view...
In a three-player game, which of the following is not one of the player designations for a payoff matrix?
A) row B) column C) chapter D) page
Quebec is capable of producing 10,000 pallets of wood shingles or 8,000 barrels of maple syrup. Vermont is capable of producing 12,000 pallets of wood shingles or 12,000 barrels of maple syrup. a. Graph these production possibilities curves. Indicate from the slope, which has the absolute advantage, which the comparative advantage, and whether there are gains from trade. b. Assume that Vermont and Quebec each specializes in the good in which they have a comparative advantage. Suppose that Vermont and Quebec decide to trade 5,000 pallets of shingles for 5,000 barrels of syrup. Indicate this on the graph. How does this affect the well-being of the two societies? Explain.
What will be an ideal response?
A theory predicts that the more a student studies, the higher his or her grades will be. This theory is
A) not falsifiable. B) falsifiable. C) too difficult a theory to test. D) inconsistent with the fact that some students study less than other students, yet receive higher grades. E) b and d
The difference between average total costs and average variable costs is:
A. marginal cost. B. fixed cost. C. average fixed cost. D. None of the statements is correct.