Solve the problem.The graphs below show the first and second derivatives of a function  . Select a possible graph f that passes through the point P.f'?f"
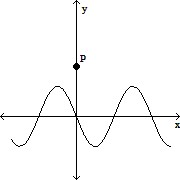 ?
?
A. 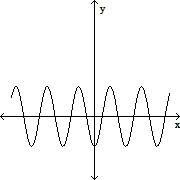
[NOTE: Graph vertical scales may vary from graph to graph.]
B. 
[NOTE: Graph vertical scales may vary from graph to graph.]
C. 
[NOTE: Graph vertical scales may vary from graph to graph.]
D. 
[NOTE: Graph vertical scales may vary from graph to graph.]
Answer: D
You might also like to view...
Write an equation for the hyperbola.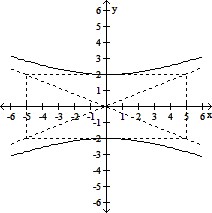
A.  -
-  = 1
= 1
B.  -
-  = 1
= 1
C.  -
-  = 1
= 1
D.  -
-  = 1
= 1
The following data, compiled by the admissions office at Faber College during the past 5 years, relate the number of college brochures and follow-up letters (x) sent to a preselected list of high school juniors who had taken the PSAT and the number of completed applications (y) received from these students (both measured in units of 1,000). x44.555.56y0.50.60.80.91.2? Determine the equation of the least-squares line for these data. Use the result obtained to predict the number of completed applications that might be expected if 6,800 brochures and follow-up letters are sent out during the next year. ?
A.  ; 1,412 applications
B.  ; 1,364 applications
C.  ; 1,387 applications
D.  ; 1,378 applications
Express the sum using summation notation. Use a lower limit of summation not necessarily 1 and k for the index of summation.3 +  + 4 +
+ 4 +  + . . . +
A. 
B. 
C. 
D. 
Find the inverse of the matrix.
A. 
B. 
C. 
D. No inverse