Give an appropriate answer.The following table shows the average price of a can of stewed tomatoes in from 2006 through 2010. 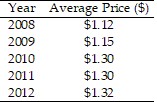 Draw a line graph that makes the increase in price look large
What will be an ideal response?
Answers may vary. One possible solution: 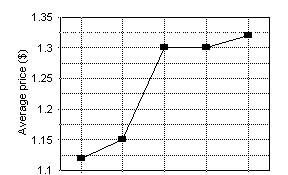
| 2008 | 2009 | 2010 | 2011 | 2012 |
| Year |
You might also like to view...
Use the graph of the function f(x) to locate the local extrema and identify the intervals where the function is concave up and concave down.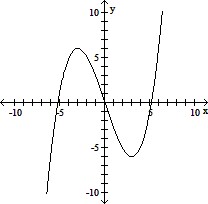
A. Local minimum at x = 3; local maximum at x = -3 ; concave up on (0, -3) and (3, ?); concave down on (-3, 3) B. Local minimum at x = 3; local maximum at x = -3 ; concave up on (0, ?); concave down on (-?, 0) C. Local maximum at x = 3; local minimum at x = -3 ; concave up on (0, -3) and (3, ?); concave down on (-3, 3) D. Local minimum at x = 3; local maximum at x = -3 ; concave down on (0, ?); concave up on (-?, 0)
Graph the inverse of the function plotted, on the same set of axes. Use a dashed curve for the inverse.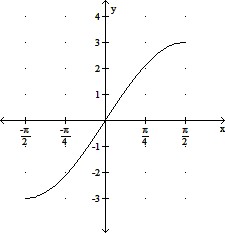
A. 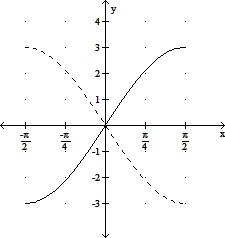
B. 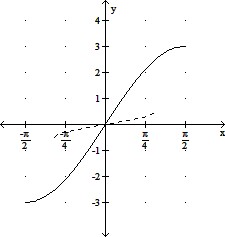
C. 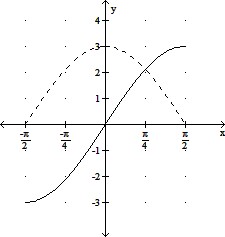
D. 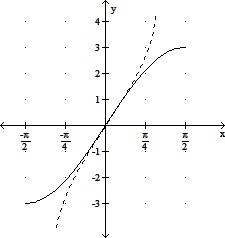
Subtract and simplify. Write the answer as a mixed number as needed.20 qt - 2
 qt
qt
A. 17 qt
qt
B. 18 qt
qt
C. 17 qt
qt
D. 17 qt
qt
Show that the given shape will tile the plane. There may be more than one correct answer. If the figure does not tile the plane, state this.![]()
What will be an ideal response?