Exhibit 5-9 Supply and Demand Curves for Good X
?
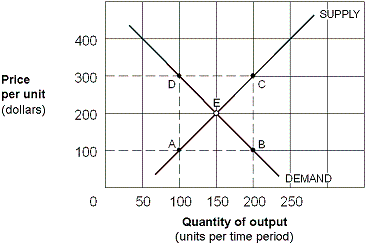
As shown in Exhibit 5-9, the $200 per unit tax on Good X raises tax revenue per time period totaling:
A. $10,000.
B. $20,000.
C. $30,000.
D. $60,000.
Answer: B
You might also like to view...
Refer to the information above. What will be the equilibrium level of GDP if taxes are reduced by 10?
A) 460 B) 470 C) 510 D) 520
Which of the following could be an example of a question that would be studied in microeconomics?
A. Why did our economic growth rate slow down during the 2000s? B. How did the recession end in 2009 if unemployment continued to rise? C. How will the legalization of marijuana in Colorado affect the market for cigarettes? D. When should Congress raise taxes in order to tackle the debt crisis?
Which of the following is added to arrive at GDP? a. The value of "free" household services provided by at home spouses rather than a paid cook, housekeeper, and baby sitter. b. The value of unpaid volunteer time
c. The unpaid services provided by the natural environment, such as breathable air. d. Net exports.
Unscrupulous managers have learned ways to manipulate stock options and undermine their benefits to stockholders. Discuss some provisions that could be built into the process to curb such practices.
What will be an ideal response?