In the above figure, the equilibrium real wage rate is
A) $10 per hour.
B) $15 per hour.
C) $20 per hour.
D) none of the above
B
You might also like to view...
Use the following diagrams for the U.S. economy to answer the next question.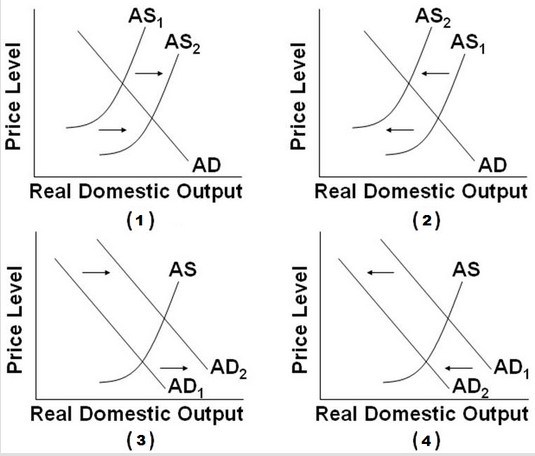 If the economy is initially at full employment, which of the diagrams best portrays a recession as a result of an increase in the cost of production?
A. Graph (1) B. Graph (2) C. Graph (3) D. Graph (4)
Marginal Revenue Product with six units of labor would be
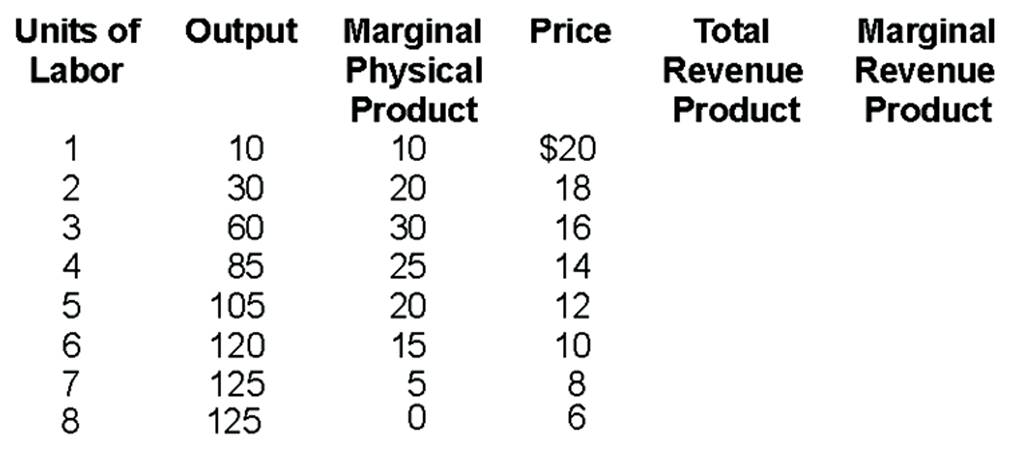
A. $70.
B. $60.
C. $120.
D. -$60.
Refer to the graph shown. Suppose the industry is currently perfectly competitive but then is taken over by a monopolist. Assuming that the monopolist maximizes profit: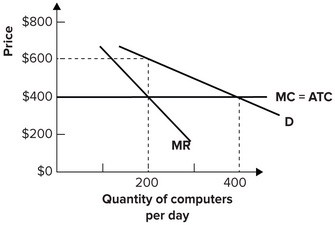
A. the price of computers will decrease from $600 to $400 and the quantity demanded will rise from 200 to 400. B. the price of computers will increase from $400 to $600 and the quantity demanded will fall from 400 to 200. C. the price of computers will increase from $400 to $600 but there will be no change in quantity demanded. D. there will be no effect on the price of computers.
?Figure 7.1 shows the U-shaped cost curves for a producer. In the figure below, A is the marginal cost curve, B is the average variable cost curve, and C is the average total cost curve. The vertical distance between lines B and C at any level of output represents _____.
a. ?average total cost b. ?average marginal cost c. ?marginal cost d. ?average fixed cost e. ?average variable cost