Graph the hyperbola and label all intercepts. -
-  = 1
= 1
A. 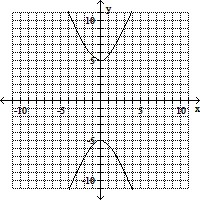
(0, 5), (0, -5)
B. 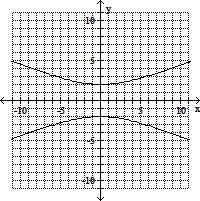
(0, 2), (0, -2)
C. 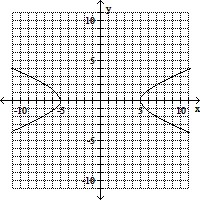
(-5, 0), (5, 0)
D. 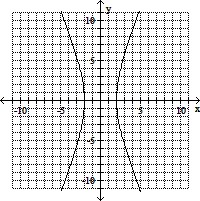
(-2, 0), (2, 0)
Answer: D
You might also like to view...
Find an equation for the line with the given properties.The solid line L contains the point (3, 1) and is parallel to the dotted line whose equation is  Give the equation for the line L in slope-intercept form.
A. y - 1 = 2(x - 3) B. y = 2x + b C. y = 2x - 2 D. y = 2x - 5
The pie chart below shows the number of pizzas consumed by college students in a typical month. Use the chart to answer the question. 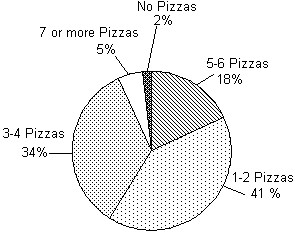 What percent of college students consume 1-2 pizzas in a typical month?
A. 18% B. 34% C. 41% D. 2%
Provide an appropriate response.Explain how the equality 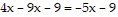 is supported by the graphs
  and
and  in a standard viewing window
What will be an ideal response?
Provide an appropriate response.What is the rule for dividing a decimal number by 0.00001?
What will be an ideal response?