Figure 2-6
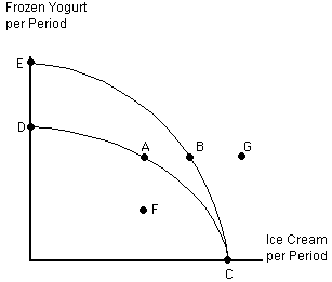
A shift in the production possibilities frontier from DC to EC in could be due to a
a.
technological improvement in the production of ice cream
b.
reduction in the rate of unemployment
c.
rise in the rate of unemployment
d.
technological improvement in the production of frozen yogurt
e.
fall in the demand for frozen yogurt
d
You might also like to view...
This graph depicts a tax being imposed, causing demand to shift from D1 to D2. According to the graph shown, the tax caused:
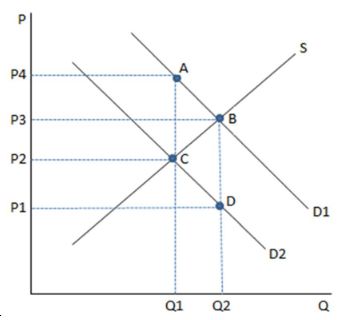
A. positive government revenue and decreased consumption.
B. zero government revenue and decreased consumption.
C. a transfer of revenue to surplus and increased consumption.
D. positive government revenue and increased consumption.
If the government wanted a tax to raise a great deal of revenue but not burden producers much, it would want to tax an industry with
a. elastic supply and demand curves. b. inelastic supply and demand curves. c. inelastic supply and elastic demand. d. elastic supply and inelastic demand.
If the government allowed a free market in organs for transplant there would be
a. a decrease in the shortage of organs for transplant. b. a decrease in producer surplus. c. an decrease in consumer surplus d. an increase in the waiting period for transplant organs.
A short-run production function was estimated asQ = ?0.002L3 + 0.16L2What is average product when it is at its maximum level?
A. 8.75 B. 6.92 C. 3.20 D. 6.00 E. 9.40