A point (3, 2) is plotted as:
a. -3 on the x-axis and +2 on the y-axis
b. +3 on the y-axis and -2 on the x-axis
c. +3 on the x-axis and -2 on the y-axis
d. +3 on the x-axis and +2 on the y-axis
e. +3 on the y-axis and +2 on the x-axis
d. +3 on the x-axis and +2 on the y-axis
You might also like to view...
Solve the problem.The following data represents the normal monthly precipitation for a certain city. 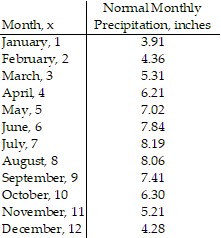 Draw a scatter diagram of the data for one period. Find the sinusoidal function of the form
 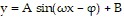 that fits the data. Draw the sinusoidal function on the scatter diagram. Use a graphing utility to find the sinusoidal function of best fit. Draw the sinusoidal function of best fit on the scatter diagram.
What will be an ideal response?
Determine the quadrant in which the terminal side of angle ? lies.sin ? > 0 and cos ? < 0
A. Quadrant II B. Quadrant IV C. Quadrant III D. Quadrant I
Round the money amount to the specified place.$99.81 to the nearest dollar
A. $0 B. $99.90 C. $90 D. $100
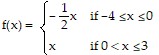
The graph of a piecewise-defined function is given. Write a definition for the function. 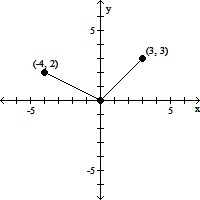
A. 
B. 
C. 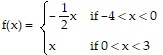
D.