Graph the linear equation.y =  x - 4
x - 4
A. 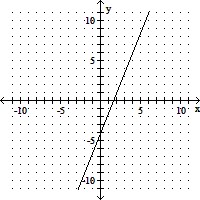
B. 
C. 
D. 
Answer: B
You might also like to view...
When a function reaches a maximum value (at a peak), the rate of change is 0.
Answer the following statement true (T) or false (F)
Use the given conditions to write an equation for the line in slope-intercept form.Passing through (3, 3) and perpendicular to x + 5y = -5
A. y = 5x - 18
B. y = -  x +
x + 
C. y = 5x - 12
D. y =  x +
x + 
Prove the identity.sin 4u = 2 sin 2u cos 2u
What will be an ideal response?
Solve the problem.The following data represents the normal monthly precipitation for a certain city in California. 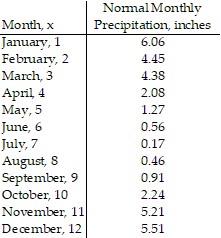 Draw a scatter diagram of the data for one period. Find a sinusoidal function of the form
  that fits the data. Draw the sinusoidal function on the scatter diagram. Use a graphing utility to find the sinusoidal function of best fit. Draw the sinusoidal function of best fit on the scatter diagram.
What will be an ideal response?