Refer to the information provided in Figure 7.9 below to answer the question(s) that follow. 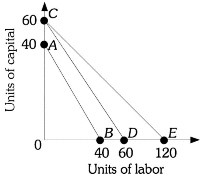 Figure 7.9Refer to Figure 7.9. The firm's isocost line could shift from AB to CD if
A. the price of capital decreased.
B. the firm's total expenditures increased by 50%.
C. the price of capital and labor each decreased by 33.3%.
D. either B or C
Answer: D
You might also like to view...
The short-run supply curve for the perfectly competitive firm is that part of the marginal cost curve that lies above the average fixed cost curve.
Answer the following statement true (T) or false (F)
A decrease in demand coupled with a decrease in supply results in a(n)
a. increase in equilibrium price and a decrease in equilibrium quantity b. decrease in equilibrium price and a decrease in equilibrium quantity c. increase in equilibrium price and a increase in equilibrium quantity d. ambiguous effect of equilibrium price and a decrease in equilibrium quantity e. ambiguous effect on equilibrium price and a increase in equilibrium quantity
Suppose that the total production of an economy consists of 10 oranges and 5 candy bars, each orange sells for $0.20, and each candy bar sells for $1.00. What is the market value of production in this economy?
A. $1.20 B. $5.00 C. $7.00 D. $2.00
Exhibit 4-8 Demand and supply curves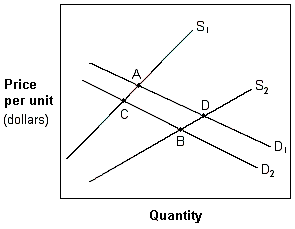 In Exhibit 4-8, a movement from A to C is best described as a(n):
A. increase in the quantity supplied and a decrease in the demand. B. decrease in the quantity supplied and a decrease in demand. C. decrease in the quantity supplied and an increase in demand. D. decrease in the quantity demanded and a decrease in supply.