Present the case for floating exchange rates
What will be an ideal response?
(1 ) Monetary policy autonomy — Governments would be able to use monetary policy to reach internal and external balance. No country would be forced to import inflation and deflation from abroad.
(2 ) Symmetry — The United States would no longer be able to set world monetary conditions all by itself. The United States would have the same opportunity as other countries to influence its exchange rate against foreign currencies.
(3 ) Exchange rates as automatic stabilizers — The long and agonizing periods of speculation preceding exchange rate realignments would not occur under floating.
You might also like to view...
Refer to the figure below. In response to gradually falling inflation, this economy will eventually move from its short-run equilibrium to its long-run equilibrium. Graphically, this would be seen as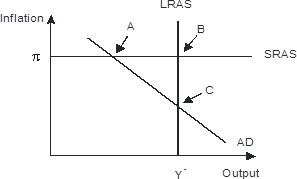
A. long-run aggregate supply shifting leftward B. Short-run aggregate supply shifting downward C. Aggregate demand shifting rightward D. Aggregate demand shifting leftward
A government may view with favor its country's importing more than it exports provided that the
a. exports are to the countries from which it imports b. imports are luxuries that have little effect on the economy c. imports are capital goods such as machinery that will be used to create future exports d. balance of payments still nets out to zero e. countries exporting to it are willing to increase their tariffs to restore balance
Suppose the exchange rate is initially set at 120 yen per dollar and increases to 140 yen per dollar. In the U.S. economy this would be expected to
A. increase the U.S. trade deficit (or decrease the trade surplus). B. decrease the U.S. trade deficit (or increase the trade surplus). C. increase the U.S. trade deficit only if exports change by more than imports. D. leave the U.S. trade deficit unchanged.
Refer to the graph shown. Assume the market is initially in equilibrium at point b in the graph but the imposition of a per-unit tax on this product shifts the supply curve up from S0 to S1. The welfare loss triangle from this tax is represented by area: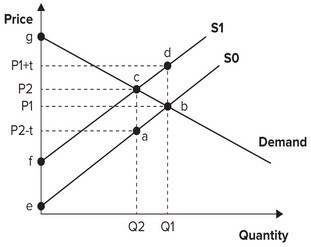
A. cfg. B. abdc. C. beg. D. abc.