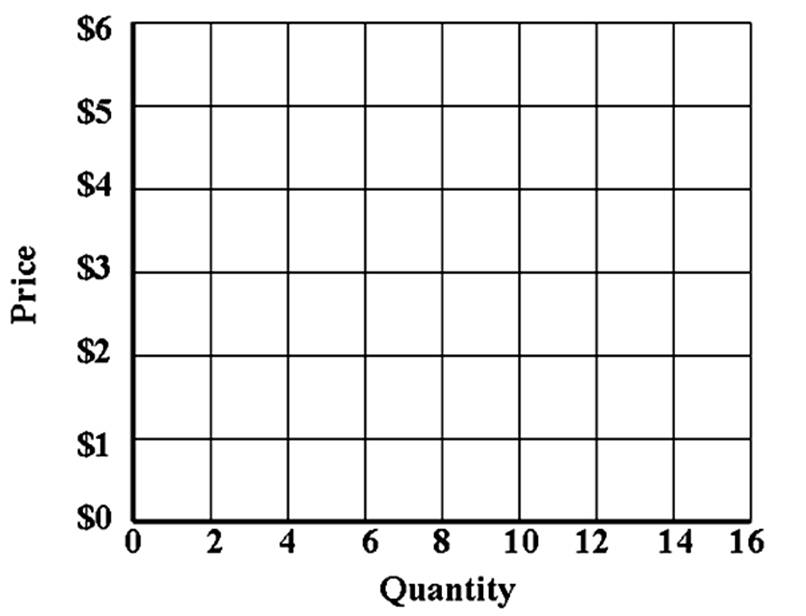
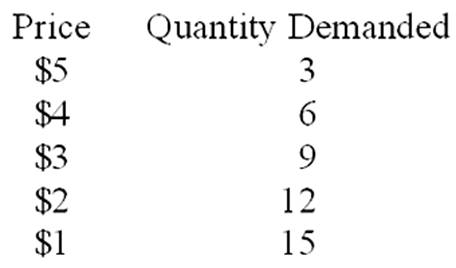
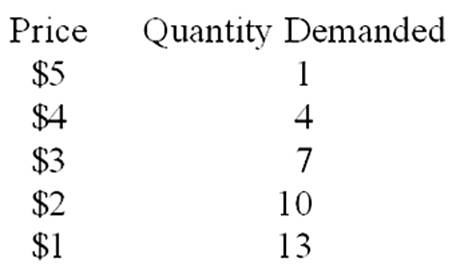
A. Using the graph below, plot the following demand schedule and label it D1. B. Using the same graph, plot the following demand schedule and label it D2. C. Based on the graph with the data you plotted, you would conclude that demand __________.
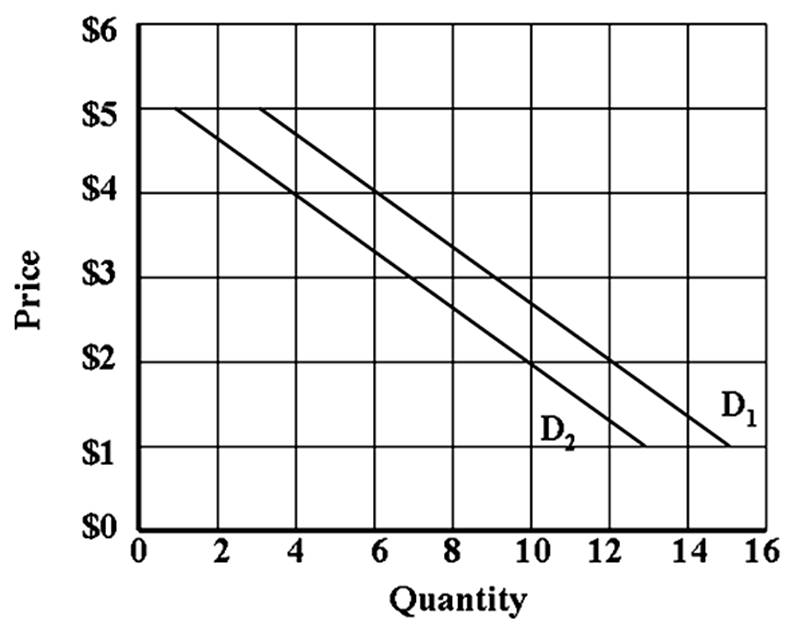
decreased
You might also like to view...
Refer to the figure below. If all buyers' reservation prices increase by $1.00, then the equilibrium price of coffee would: 
A. increase by more than $1.00. B. would not change. C. increase by less than $1.00. D. increase by $1.00.
By looking at the graph showing the poverty rate from 1959 to 2016, you can see that poverty increased ______.
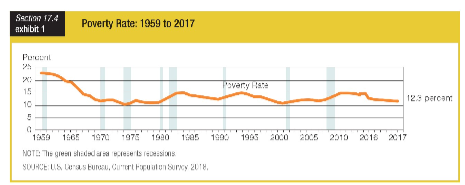
a. in the 1960s
b. in the 1970s
c. in early 1990s
d. between 2012 and 2016
There is no relationship between a country's productivity and its standard of living.
Indicate whether the statement is true or false.
A demand curve is defined as the relationship between:
A. the price of a good and the quantity of that good that consumers are willing to buy. B. the price of a good and the quantity of that good that producers are willing to sell. C. the income of consumers and the quantity of a good that consumers are willing to buy. D. the income of consumers and the quantity of a good that producers are willing to sell.