Divide. Write the answer in lowest terms and as a whole or mixed number where possible. ÷ 2
÷ 2
A. 3
B. 
C. 
D. 
Answer: B
You might also like to view...
Graph the function by hand. Use the graph to (a) find the range, (b) give the interval over which the function is increasing, and (c) give the interval over which the function is decreasing. Round approximations to two decimal places.f(x) = 
A. (a) [0, ?) (b) (-?, -1.40) (c) (1.40, ?) B. (a) [0, ?) (b) (1.40, ?) (c) (-?, -1.40) C. (a) [-49, ?) (b) (0, ?) (c) (-?, 0) D. (a) [0, ?) (b) (1.40, ?) (c) (-?, 1.40)
Give the coordinates of the points shown on the graph.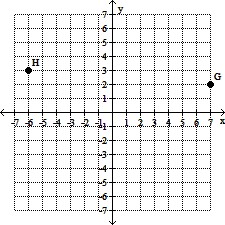
A. G(7, 2), H(-6, 3) B. G(7, 2), H(3, -6) C. G(7, 3), H(2, 3) D. G(2, 30), H(3, -6)
Evaluate the expression for the given replacement values. -
-  - 11.7
 for x = -4 and z = 5
A. 10.7 B. -20.7 C. -2.7 D. -12.7
Present data in the form of tables. For the data set shown by the table, a. Create a scatter plot for the data. b. Use the scatter plot to determine whether an exponential function or a logarithmic function is the best choice for modeling the data.Percentage of Population Living in the South Suburbs of a Large City 
What will be an ideal response?