The graph below represents the market for a product where D1 and S1 show the initial supply and demand curves, and supply shifts to S2 due to a sales tax. The government's tax revenue is represented by area:
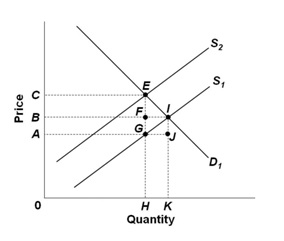
A. FIJG
B. ACEG
C. BCEF
D. ABFG
B. ACEG
You might also like to view...
There is only one firm in a small island country. The firm produced 1,000 units of Good X during a particular year out of which it could sell 900. If each unit of the good sells for $500, what is the gross domestic product of the country?
A) $150,000 B) $450,000 C) $40,000 D) $500,000
If in the third quarter of 2016 total investment spending was $4,768 billion and depreciation was $3,292 billion, then the amount counted in GDP, which is known as gross investment, would be
A) $1,476 billion. B) $3,292 billion. C) $4,768 billion. D) $8,060 billion.
Decrease in the real interest rate will ________ the expenditure curve:
A) decrease. B) increase. C) not change. D) none of the above.
In the Keynesian theory, output and employment in the economy depend
A. directly on the level of total expenditures. B. inversely on the quantity of resources available to it. C. directly on the level of disposable income. D. directly on the rate of interest.