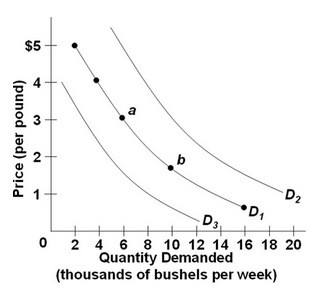
 Refer to the above diagram, which shows three demand curves for coffee. Which would cause the change in the quantity of coffee demanded illustrated by the shift from point a to point b?
A. A decrease in the price of coffee
B. A decrease in the price of sugar
C. An increase in consumer incomes
D. An increase in the price of tea
Answer: A
You might also like to view...
There are currently 1,000 firms in a competitive industry. Minimum long-run average cost is $80 and price $100. Explain what will happen to price, profit, and the number of firms in this industry over time.
What will be an ideal response?
The peak oil hypothesis says that the annual world production of oil
a. will not peak for several hundred years. b. peaked in the past two decades and is now rapidly declining. c. will peak in the coming decades and then decline. d. is now peaking and a major decline is imminent.
In 2002, the United States placed higher tariffs on imports of steel. According to the open-economy macroeconomic model this policy should have
a. reduced imports into the United States and made U.S. net exports rise. b. reduced imports into the United States and made the net supply of dollars in the foreign exchange market shift right. c. reduced imports of steel into the United States, but reduced U.S. exports of other goods by an equal amount. d. reduced imports of steel into the United States and increased U.S. exports of other goods by an equal amount.
Unemployment that results when there are more people seeking jobs in a labor market than there are jobs available is called:
What will be an ideal response?