Use a graphing utility to find the equation of the line of best fit. Round to two decimal places, if necessary.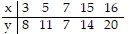
A. y = 0.85x + 3.07
B. y = 0.75x + 4.07
C. y = 0.95x + 3.07
D. y = 0.75x + 5.07
Answer: D
You might also like to view...
Solve the problem.dy/dt = ky + f(t) is a population model where y is the population at time t and f(t) is some function to describe the net effect on the population. Assume k = .02 and  when t = 0. Solve the differential equation of y when f(t) = -19t.
A. y = 950t + 47,500 - 37,500e.02t B. y = -950t - 47,500 - 37,500e.02t C. y = 950t + 47,500 - 37,500e-.02t D. y = -950t + 47,500 - 37,500e-.02t
Use the data to construct a frequency distribution.The ages of 30 swimmers who participated in a swim meet are as follows:18, 36, 30, 33, 40, 18, 50, 59, 19, 43, 51, 19, 26, 28, 41, 20, 29, 20, 58, 49, 24, 37, 46, 53, 33, 22, 22, 41, 30, 49Construct a grouped frequency distribution for the data. Use the classes src="https://sciemce.com/media/4/ppg__rrrr0613190819__f1q110g5.jpg" alt="" style="vertical-align: -4.0px;" />.
What will be an ideal response?


Solve the problem.Your cable bill increased last year. For the first 5 months your bill was $25.89 each month. For the remaining 7 months it was $27.89 each month. Find the average amount of your cable bill for the year.
A. $32.47 B. $324.68 C. $27.06 D. $26.89
The graph of a function is given. Determine whether the function is increasing, decreasing, or constant on the given interval.(- 3, -  )
)
A. constant B. increasing C. decreasing