Find the mean, median, and mode. Round to the nearest tenth when necessary.Given these class sizes: 1, 2, 8, 10
A. 5.3, 5, none
B. 4.8, 5, 8
C. 3.7, 5, none
D. 5.3, 5, 2
Answer: A
You might also like to view...
Evaluate the cylindrical coordinate integral.
A. 60? B. 20? C. 40 D. 60
First, create a scatter plot for the data in the table. Then, use the shape of the scatter plot given to determine if the data are best modeled by a linear function, an exponential function, a logarithmic function, or a quadratic function.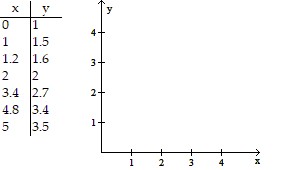
A. 
quadratic function
B. 
exponential function
C. 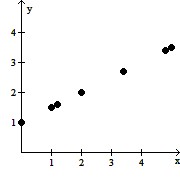
linear function
D. 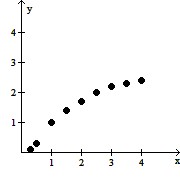
logarithmic function
Solve the problem.The table below gives the violent crime rate (per 100,000 people) for a particular state every five years from 1970 to 2010.  Use technology to find the cubic function that is the best fit for this data, where x is the number of years after 1970. Use the model to estimate the violent crime rate for the year 2014.
A. 11 B. 11.8 C. 11.6 D. 11.4
Find the sum.
A. - 4
B. 10
C. 
D. Does not exist