Provide the proper response.To graph  -
-  = 1 on a graphics calculator, we must consider the union of the graphs of the two functions. y1 = 6
 and y2 = -6
 . Using the graph of y =
  - 1, explain (a) how the solution set of
src="https://sciemce.com/media/4/ppg__ttt0516191436__f1q51g6.jpg" style="vertical-align: -17.0px;" /> - 1 ? 0 can be determined graphically and (b) how it relates to the domain of the hyperbola.
What will be an ideal response?
The graph of y =  - 1 lies above or on the x-axis in
  This set is the same as the domain of the given hyperbola.
Mathematics
src="https://sciemce.com/media/4/ppg__ttt0516191436__f1q51g6.jpg" style="vertical-align: -17.0px;" /> - 1 ? 0 can be determined graphically and (b) how it relates to the domain of the hyperbola.
What will be an ideal response?
The graph of y = - 1 lies above or on the x-axis in This set is the same as the domain of the given hyperbola.
You might also like to view...
Evaluate the double integral over the given region.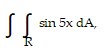 R =
R = 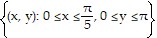
A. 
B. ?
C. 
D. 
Construct a histogram of the given frequency distribution.The frequency distribution indicates the test averages of a group of 840 students.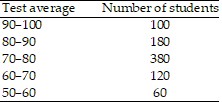
A. 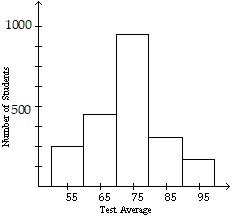
B. 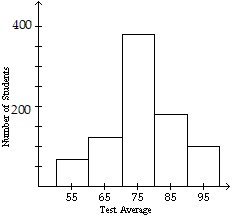
C. 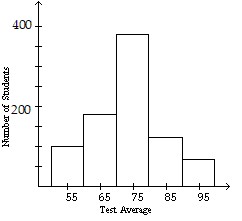
D. 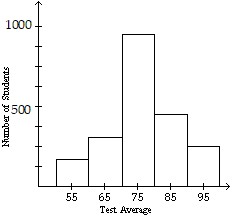
Provide an appropriate response.The product is equal to the multiplicand times the multiplier.
A. True B. False
Determine any local or absolute extrema as indicated.g(x) = |x| + 9
A. Local maximum: 9; absolute maximum: 9 B. Local minimum: 0; absolute minimum: 0 C. Local minimum: 9; absolute minimum: 9 D. Local minimum: -9; absolute minimum: -9