Use the following graph to answer the next question.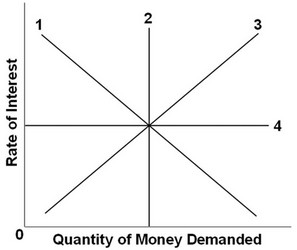 Which line in the graph above would best illustrate the asset demand for money curve?
A. Line 1
B. Line 2
C. Line 3
D. Line 4
Answer: A
You might also like to view...
For the firm in Figure 8.1, the profit-maximizing (loss-minimizing) price and level of output are:
A) P2 and Q2. B) P1 and Q1. C) P4 and Q1. D) P3 and Q1.
A decrease in the money supply
a. raises the interest rate, causing an increase in quantity demanded of investment and an increase in GDP b. lowers the interest rate, causing an increase in quantity demanded of investment and an increase in GDP c. raises the interest rate, causing a decrease in quantity demanded of investment and a decrease in GDP d. lowers the interest rate, causing a decrease in quantity demanded of investment and an increase in GDP e. lowers the interest rate, causing a decrease in quantity demanded of investment and a decrease in GDP
National income equals gross national product minus
A) imports. B) depreciation. C) inventories. D) changes in inventories.
If a person wanted to raise some capital and was unable to borrow it, they could either ________ or _________.
Fill in the blank(s) with the appropriate word(s).