The set of __________ numbers is { ... -3, -2, -1, 0, 1, 2, 3, ...}.
A. irrational
B. whole
C. integer
D. natural
E. negative
Answer: C
You might also like to view...
Use the vertex and intercepts to sketch the graph of the quadratic function.f(x) = 4 - (x - 2)2 
A. 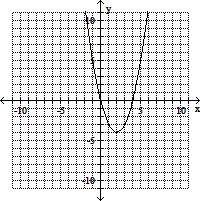
B. 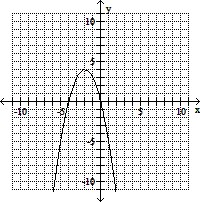
C. 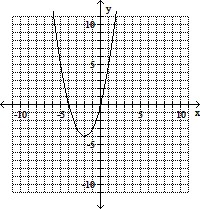
D. 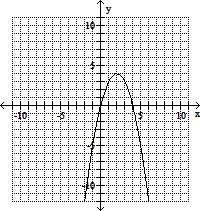
Indicate whether the graph of the equation is a parabola, circle, ellipse, or hyperbola.x2 = 100 + 4y2
A. parabola B. circle C. ellipse D. hyperbola
Solve the problem.Suppose that the speed of a car, measured in miles per hour (mph), is monitored for some short period of time after the driver applies the brakes. The following table and graph relate the speed of the car to the amount of time, measured in seconds (sec), elapsed from the moment that the brakes are applied.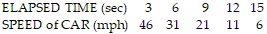
 What general trend do the data reflect? In which of the time intervals does the speed change the most?
A. With increasing elapsed time, the speed decreases. The speed changes most during the time interval from 12 seconds to 15 seconds. B. With increasing elapsed time, the speed decreases. The speed changes most during the time interval from 3 seconds to 6 seconds. C. With increasing elapsed time, the speed increases. The speed changes most during the time interval from 12 seconds to 15 seconds. D. With increasing elapsed time, the speed increases. The speed changes most during the time interval from 3 seconds to 6 seconds.
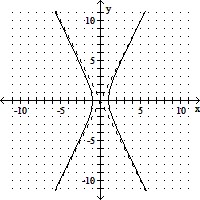
Graph.16x2 - 4y2 = 64
A. 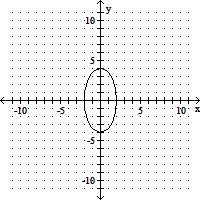
B. 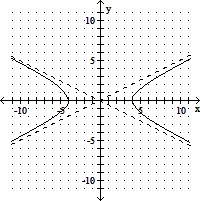
C. 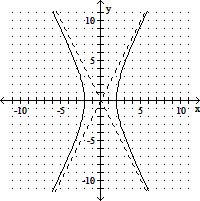
D.