Refer to the graph. Each of the three labor demand curves shown slopes downward because of the:
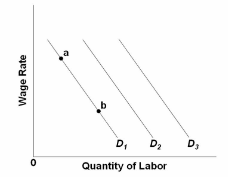
A. law of diminishing marginal utility.
B. law of increasing opportunity costs.
C. principal-agent problem.
D. law of diminishing returns.
D. law of diminishing returns.
You might also like to view...
Suppose that the marginal propensity to consume is 0.75
a. If the government decreases spending by $500 billion, what is the change in output? b. If the government decreases taxes by $500 billion, what is the change in output? c. If the government decreases transfer payments by $500 billion, what is the change in output? d. If the government decreases spending by $500 billion and at the same time decreases taxes by $500 billion, what is the change in output?
When would you use a one-tailed rather than a two-tailed t-test when checking significance levels?
What will be an ideal response?
The relationship between households' planned consumption expenditures and households' level of disposable real income is called
A) the consumption function. B) the savings function. C) the investment function. D) the household aggregate demand function.
Suppose caviar sales soars at the same time price increases. What would lead to both a higher quantity sold and higher price of caviar?
A. A shift in demand to the right and a larger shift in supply to the right. B. A shift in demand to the left and a smaller shift in supply to the left. C. A shift in demand to the left and a smaller shift in supply to the right. D. A shift in demand to the right and a shift in supply to the left.