What percent of the world's power is generated from renewable sources?
A) 10%
B) 5%
C) 7%
D) 3%
E) 20%
D
You might also like to view...
Using the temperature graphs provided in Figure 8.1, plot the data from Table 8.1 for these two cities. Use a smooth curved line graph to portray the temperature data. Calculate the average annual temperature and the temperature range (difference between the highest and lowest) for each city.
What will be an ideal response?
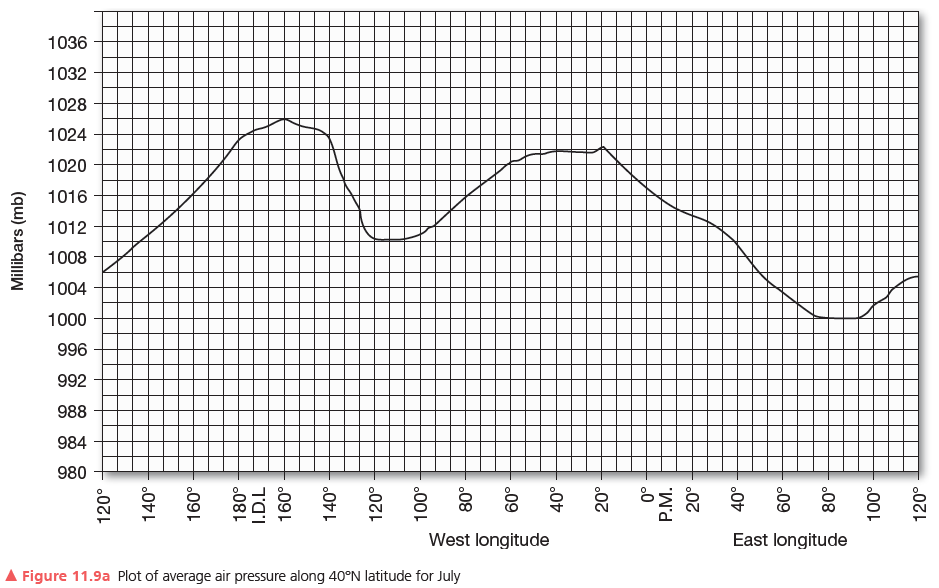
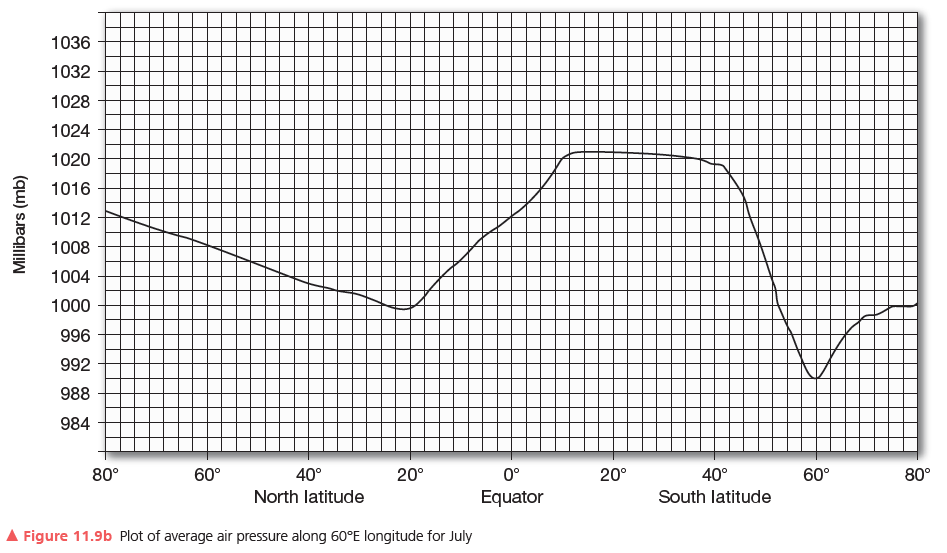
Comparing the two sets of graphs (Figures 9.3 and 9.4 with Figures 11.8 and 11.9), what correlation can be seen between global temperature and pressure patterns? Select a few areas that seem to illustrate a link between your graphs.
Refer to the global air temperature profiles you plotted in Section 2 of Lab Exercise 9 (temperature maps in Figure 9.2a (January) and 9.2b (July), and your graphs in Figures 9.3a and 9.3b and Figures 9.4a and 9.4b). Those temperature profiles in Lab Exercise 9 and these pressure profiles you just completed for this exercise are along the same parallels and meridians.
Pleistocene gold deposits were formed through Cenozoic plutonic activity. Indicate whether the statement is true or false
Primary coasts are coasts that have features created by marine processes.
Answer the following statement true (T) or false (F)