The authors open Chapter 17 with a contrast between the Fed's actions in response to the terrorist attacks of September, 2001 and its response to the financial crisis of the Great Depression. Why was the Fed successful at dealing with the crisis in 2001, and not as successful with the crisis of the early 1930s?
What will be an ideal response?
The primary difference is that in the early 1930s Fed officials didn't fully understand how their actions affected the supply of credit in the economy. The Fed failed to recognize the link between changes in its balance sheet and the growth rate of money. It believed that as long as the account balances of commercial banks at the Federal Reserve Banks were growing that credit and money were easily available. It was wrong. The financial system collapsed in the 1930s because Fed officials had failed to provide the liquidity that sound banks needed to stay in business. This is exactly what it did right in 2001, announcing that the discount window was available to meet liquidity needs.
You might also like to view...
The difference between the price the seller receives for a good or service and the minimum price he would be willing to accept for that unit is called: a. the total gains from trading that unit. b. the gain in producer surplus
c. the gain in consumer surplus. d. the total surplus.
Assume that foreign capital flows from a nation increase due to political uncertainly and increased risk. If the nation has highly mobile international capital markets and a fixed exchange rate system, what happens to the quantity of real loanable funds and monetary base in the context of the Three-Sector-Model? a. The quantity of real loanable funds rises and monetary base rises
b. The quantity of real loanable funds rises and monetary base falls. c. The quantity of real loanable funds falls and monetary base falls. d. The quantity of real loanable funds and monetary base remain the same. e. There is not enough information to determine what happens to these two macroeconomic variables.
Refer to the accompanying figure. A decrease in supply is represented by a shift from: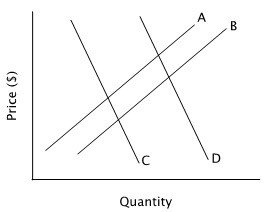
A. curve B to curve A. B. curve D to curve C. C. curve C to curve D. D. curve A to curve B.
According to the official U.S. threshold, 35 percent of Americans live in poverty.
Answer the following statement true (T) or false (F)