Solve. If necessary, round percents to the nearest tenth, dollar amounts to the nearest cent, and all other numbers to the nearest whole.Find the amount of decrease and the percent decrease if the original amount is  and the new amount is -5,304.
A. 5,408; 5,300%
B. 5,408; 5,210%
C. 5,408; 5,195%
D. 5,408; 5,200%
Answer: D
You might also like to view...
The following table shows the hourly wage W, in dollars, of a certain worker t years after 2000. t0246 A $16.87 $18.96 $21.30 $23.93? A: Make a table of successive ratios to show that the wage can be modeled by an exponential function. Round your answer to two decimal places.B: Find an exponential model for the data. Be careful. The data are presented in 2-year increments. Round your answer to two decimal places.C: Plot the graph of the data points along with the exponential model. Include up through 2010.D: According to the model, the worker got a pay raise each year. What percentage raise did the worker get each year? Round your answer to two decimal places.
What will be an ideal response?
Write the standard form of the equation of the circle with radius r and center (h, k).r =  ; (h, k) = (8, 3)
A. (x - 8)2 + (y - 3)2 = 3 B. (x + 3)2 + (y + 8)2 = 9 C. (x - 3)2 + (y - 8)2 = 9 D. (x + 8)2 + (y + 3)2 = 3
Use Euler's method with given values of n to obtain an approximation of the initial value problem when  . Round your answers to four decimal places, if necessary.
?
 ,
, 
?
 ,
,  __________
?
 ,
,  __________
What will be an ideal response?
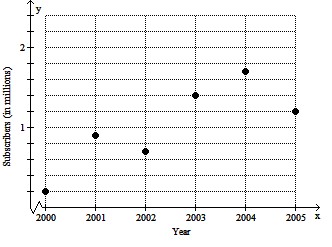
Solve the problem.The table gives the number of basic cable TV subscribers (in millions) for a certain region for the years shown.  a. Write this data as a set of ordered pairs of the form (year, number of basic cable TV subscribers in millions).b. Create a scatter diagram of the data. Be sure to label the axes properly.
A. (2000, 0.2), (2001, 0.9), (2002, 0.7), (2003, 1.4), (2004, 1.7), (2005, 1.2)
B. (0.2, 2000), (0.9, 2001), (0.7, 2002), (1.4, 2003), (1.7, 2004), (1.2, 2005)