Today, U.S. government spending on entitlements represents ________ of the total federal budget
A) about 10 percent
B) less than 25 percent
C) nearly 60 percent
D) nearly 90 percent
C
You might also like to view...
Which of the following did the 1986 Tax Reform Act not intended to do?
a. lower marginal tax rates b. broaden the tax base c. keep average tax rates the same d. reduce the bias towards saving
Suppose the population of a country falls, but its Real GDP remains constant. As a result, there is __________ economic growth
A) both absolute economic growth and per-capita real B) absolute economic growth, but not per-capita real C) per-capita real economic growth, but not absolute D) neither absolute economic growth nor per-capita real
Exhibit 3-3 Demand curves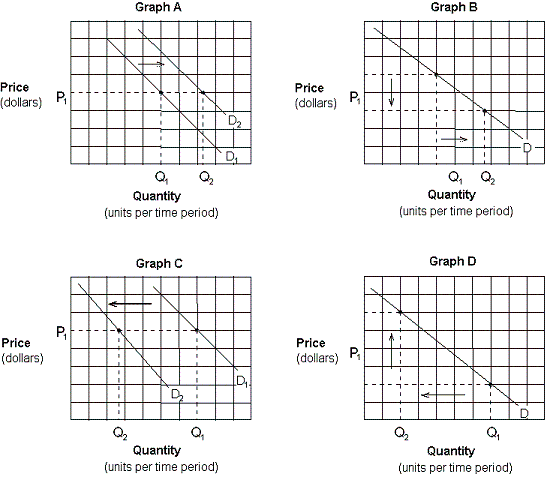 Which of the graphs in Exhibit 3-3 depicts the effect of a decrease in the price of pizza on the demand curve for pizza?
A. Graph A. B. Graph B C. Graph C. D. Graph D.
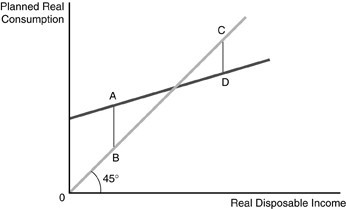 Refer to the above figure. The figure represents the consumption function for a consumer. The distance between C and D represents
A. the amount of saving. B. the point where saving equals zero. C. the amount of autonomous consumption. D. the amount of dissaving.