Graph the numbers on the number line. , -
, - 
A. ![]()
B. ![]()
C. ![]()
D. ![]()
Answer: B
You might also like to view...
Use the known graph of y = ln x to graph the equation.f(x) = ln(x + 4) 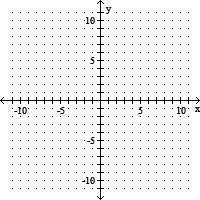
A. 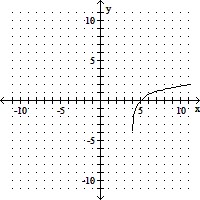
B. 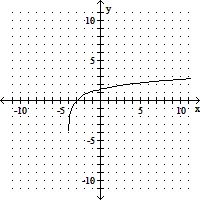
C. 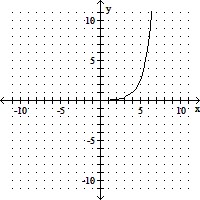
D. 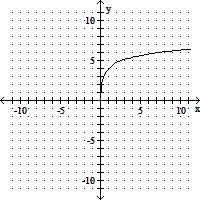
The following table shows the number C, in millions, of cars sold in the U.S. t years after 2005. Use the regression line for the data to estimate the number of cars sold in 2013. t 0 1 3 5 C 5.54 5.46 5.24 4.54? ?
A. 3.70 million B. 4.92 million C. 3.16 million D. 4.11 million
The graph below shows the approximate annual percentage growth rate in world population for the years 1960 through 2010. Data is estimated by the UN Census Bureau.Annual Growth Rate (Percentage)  Use the graph to answer the question.Describe the trend in world population during the period 1976-1978
A. It remains constant B. It increases at a steady rate C. It increases at a faster and faster rate D. It decreases at a steady rate
Evaluate the integral.
A. cosh-1 4x + C
B. -  cosh 4x + C
C. cosh 4x + C
D.  cosh 4x + C