Solve the linear inequality. Express the solution using set-builder notation and interval notation. Graph the solution set.-4(2x + 3) ? 2[3x - 2(x - 3)]
A.  ;
; 
![]()
B.  ;
; 
![]()
C.  ;
; 
![]()
D.  ;
; 
![]()
Answer: C
You might also like to view...
The stack plot below shows the value of each of Danny's investments. The stack plot contains three regions. The uppermost unshaded region represents the value of Danny's investment in individual stocks. The center shaded region represents the value of Danny's investment in mutual funds and the bottom region in black represents the value of Danny's investment in a CD. The thickness of a region at a particular time tells you its value at that time.  Use the graph to answer the question.In which year was the value of Danny's investment in individual stocks the highest?
A. year 0 B. year 8 C. year 4 D. year 5
Solve the inequality and graph the solution set. < 4
< 4![]()
A. ![]()
B. ![]()
C. ![]()
D. ![]()
Use the graph to determine whether the data represent direct variation, inverse variation, or neither.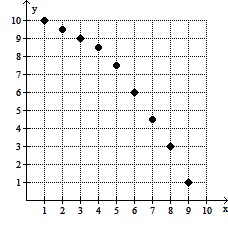
A. Neither B. Direct C. Inverse
Decide whether the statement is compound. is rational and
  is irrational.
A. Compound B. Not compound