Solve the problem.In a Psychology class, the students were tested at the end of the course on a final exam. Then they were retested with an equivalent test at subsequent time intervals. Their average scores after t months are given in the table.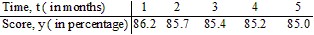 Using a graphing utility, fit a logarithmic function y = a + b ln x to the data. Using the function you found, estimate how long will it take for the test scores to fall below 84%. Express your answer to the nearest month.
A. 12 months
B. 20 months
C. 8 months
D. 10 months
Answer: B
You might also like to view...
Write the number in scientific notation.308.57
A. 3.0857 × 10⁻¹ B. 3.0857 × 10² C. 3.0857 × 101 D. 3.0857 × 10⁻²
Present data in the form of tables. For the data set shown by the table, a. Create a scatter plot for the data. b. Use the scatter plot to determine whether an exponential function or a logarithmic function is the best choice for modeling the data.Percentage of Population Living in the South Suburbs of a Large City 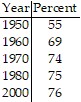
What will be an ideal response?
Analyze the graph of the given function f as follows:(a) Determine the end behavior: find the power function that the graph of f resembles for large values of |x|.(b) Find the x- and y-intercepts of the graph.(c) Determine whether the graph crosses or touches the x-axis at each x-intercept.(d) Graph f using a graphing utility.(e) Use the graph to determine the local maxima and local minima, if any exist. Round turning points to two decimal places.(f) Use the information obtained in (a) - (e) to draw a complete graph of f by hand. Label all intercepts and turning points.(g) Find the domain of f. Use the graph to find the range of f.(h) Use the graph to determine where f is increasing and where f is decreasing.f(x) = (x - 3)(x - 1)(x + 2)
What will be an ideal response?
Find the indicated intercept(s) of the graph of the function.x-intercepts of f(x) = 
A. 
B. 
C. (6, 0)
D. (-6, 0)