The diagram is the basis for explaining:
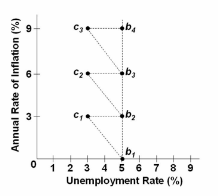
A. the traditional Phillips Curve.
B. the long-run Phillips Curve.
C. how central planning can make full employment and price level stability compatible goals.
D. new policies for eliminating unemployment.
B. the long-run Phillips Curve.
You might also like to view...
In October 2012, the largest liability of the Fed was
A) currency in circulation. B) reserves. C) discount loans to banks. D) vault cash.
Refer to Scenario 7.3. Which of the following combinations of inputs is on the isoquant to produce 400 units of output?
A) L = 0, K = 400 B) L = 400, K = 0 C) L = 100, K = 100 D) all of the above E) A and B, but not C
The "housing bubble" discussed in the text book refers to:
A. housing prices rising much more quickly than the rest of prices in the economy. B. housing prices within a certain area of the U.S. rising disproportionately with the rest of houses in the economy. C. an unexplained increase in the demand for houses which caused the prices of houses to rise. D. a supply shock to the housing market, which caused housing prices to increase.
Assume that a purely competitive firm uses two resources—labor (L) and capital (C)—to produce a product. In which situation would the firm be maximizing profit?
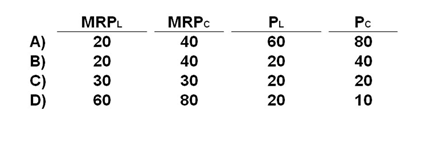
A. Choice A
B. Choice B
C. Choice C
D. Choice D