Graph the inequality.y ? 3x
A. 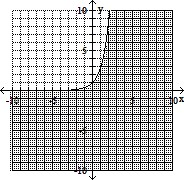
B. 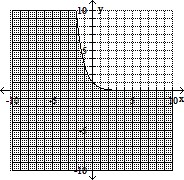
C. 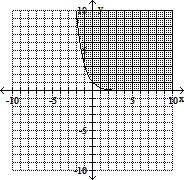
D. 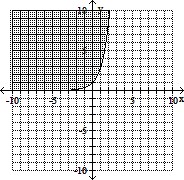
Answer: A
You might also like to view...
Create a graphical display for the data given. You may choose any graphic type that you feel is appropriate. Write a few sentences explaining why you chose this type of display and a few sentences describing any interesting patterns in the data.The table below shows the population by year for various countries. Population is given in millions. 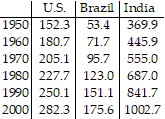
What will be an ideal response?
Solve.Find the perimeter of the triangle. Simplify.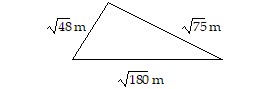
A. 15 meters
B. (9 + 6
+ 6 ) meters
C. ( +
+  +
+  ) meters
D. (60 + 6 ) meters
Divide the real numbers. Write any improper fraction as a whole or mixed number where appropriate.-4 ÷ 
A. - 
B. 2
C. - 2
D. 
The line graph shows the recorded hourly temperatures in degrees Fahrenheit at an airport. 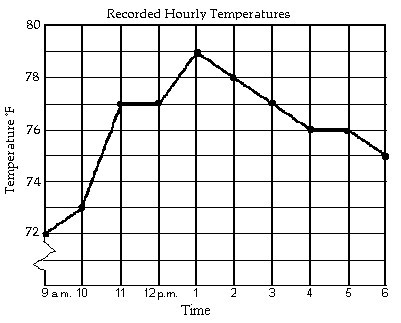 During which hour did the temperature increase the most?
A. 10 a.m. to 11 a.m. B. 12 p.m. to 1 p.m. C. 9 a.m. to 10 a.m. D. 1 p.m. to 2 p.m.