Refer to the diagram. Which of the following would increase investment while leaving an existing investment demand curve, say, ID 2 , in place?
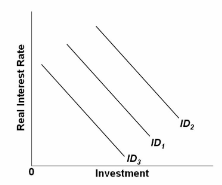
A. A lower interest rate.
B. A higher interest rate.
C. Lower expected returns on investment.
D. Higher expected returns on investment.
A. A lower interest rate.
You might also like to view...
Money is NOT
A. a medium of exchange. B. a standard of value. C. a store of value. D. the exclusive means of holding wealth.
OutputTotal Cost0$24133241348454561669Refer to the above data. The average fixed cost of producing 3 units of output is:
A. $5.50. B. $8. C. $6. D. $7.40.
Explain the relationship between coupon rate (or coupon yield) and current yield.
What will be an ideal response?
Refer to the information provided in Figure 8.8 below to answer the question(s) that follow. 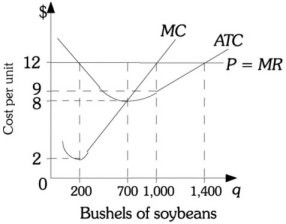 Figure 8.8 Refer to Figure 8.8. If the market price of soybeans falls to $8, then to maximize profits this farmer should produce
A. 200 bushels of soybeans. B. 700 bushels of soybeans. C. 1,000 bushels of soybeans. D. a level of output that is indeterminate from this information.