Divide using long division.
A. 36 r 2
B. 38
C. 36
D. 36 r 6
Answer: A
You might also like to view...
Make a bar graph to represent the data.The following table shows the number of male infants born at Hospital X on New Year's Day (Jan. 1). Create a horizontal bar graph.
What will be an ideal response?
Add or subtract. Express the answer as a mixed number.-6 + 15
+ 15
A. 8
B. 9
C. 8
D. 7
Match the graph with its function using the x-intercepts.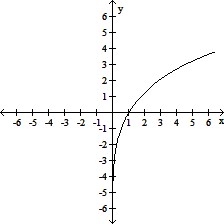
A. y = x1/3 - 8x1/6 + 9 B. y = x1/3 + 8x1/6 + 9 C. y = x1/3 - 8x1/6 - 9 D. y = x1/3 + 8x1/6 - 9
Suppose that the average adult in the United States will work x number of days (rounded to the nearest day) to earn enough to pay for all of the household's leisure activities in that year. This number can be calculated by multiplying the average percent of household income spent on leisure activities by 365 (the number of days in a year). The bar graph shows the percent of income spent in various countries of the world. Use the graph to answer the question.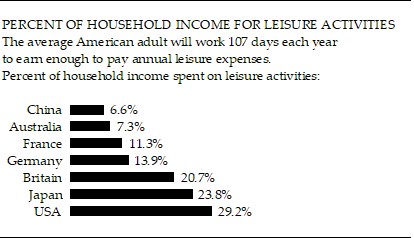 In which country is the lowest percent of income spent on leisure activities? What percent is this?
A. China; 6.6% B. USA; 70.8% C. China; 93.4% D. Australia; 7.3%