Refer to the above figure. Profits will be negative
A) when the price equals $2.
B) when the price is above $2.
C) when the price is below $2.
D) only when the price equals $1.
C
You might also like to view...
Refer to the table below. Pat's opportunity cost of making a pizza is delivering: Pizzas MadePer HourPizzasDeliveredPer HourCorey126Pat1015
A. 2 pizzas B. 2/3 of a pizza C. 3 pizzas D. 3/2 of a pizza
A graph that shows all the equally preferred combinations of two goods is called a(n)
a. demand curve b. supply curve c. consumer surplus curve d. equalization curve e. indifference curve
Negative externalities lead markets to produce
a. greater than efficient output levels and positive externalities lead markets to produce smaller than efficient output levels. b. smaller than efficient output levels and positive externalities lead markets to produce greater than efficient output levels. c. greater than efficient output levels and positive externalities lead markets to produce efficient output levels. d. efficient output levels and positive externalities lead markets to produce greater than efficient output levels.
Refer to the graphs below. Which graph shows a change in the buyer's income, but no changes in the prices of X and Y?
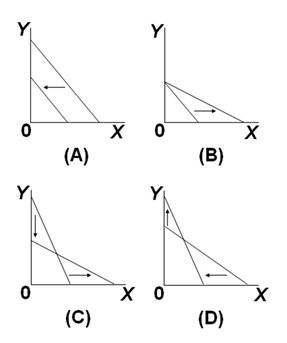
A. Graph A
B. Graph B
C. Graph C
D. Graph D